ItsMiner Dashboard - A Comprehensive Guide
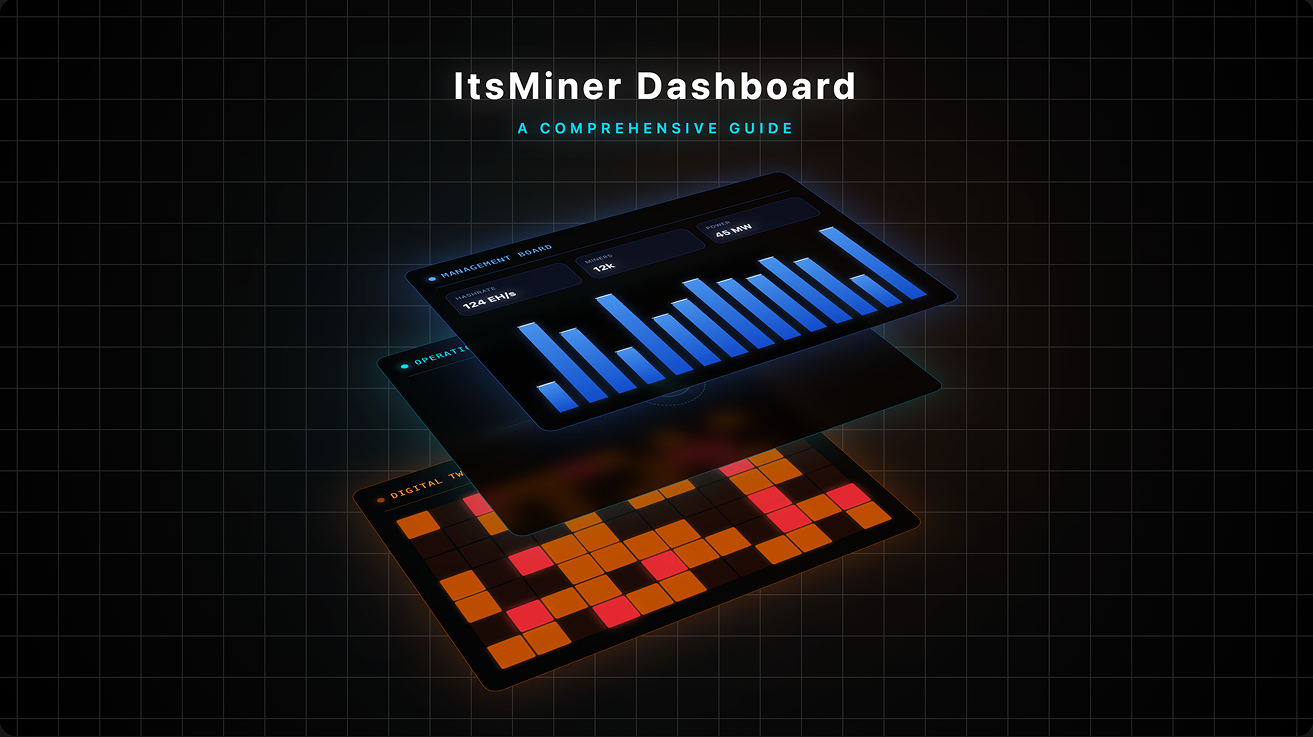
The modern cryptocurrency mining landscape demands more than just hardware; it requires a sophisticated, data-driven approach to manage thousands of machines across global sites. ItsMiner, a professional full-stack operation and maintenance (O&M) platform, with its dual dashboards—the Business Dashboard and the Operations & Maintenance Dashboard—provides tailored insights for different stakeholders in the mining ecosystem.
1. The Dual-Dashboard Strategy: Positioning and Differences
ItsMiner distinguishes between business health and technical efficiency by offering two distinct dashboard views. This separation ensures that users are not overwhelmed by irrelevant data and can focus on their specific responsibilities.
The Business Dashboard
The Business Dashboard is designed for farm managers, owners, and investors. Its primary goal is to provide a "big picture" view of the farm's profitability, client obligations, and overall resource consumption. It emphasizes ROI-related metrics such as revenue, electricity costs, and client hosting status.
The Operations&Maintenance Dashboard
The Operations & Maintenance Dashboard is the primary tool for the on-site O&M team. It focuses on real-time technical performance and fault localization. Instead of revenue, it highlights hashrate fluctuations, specific hardware failures, and "problem areas" like racks with high failure rates. Its purpose is to drive maintenance efficiency and minimize downtime.
2. Detailed Analysis of Dashboard Data Blocks
I. Business Dashboard Features
The Business Dashboard acts as a centralized command center for the business aspects of a mining operation.
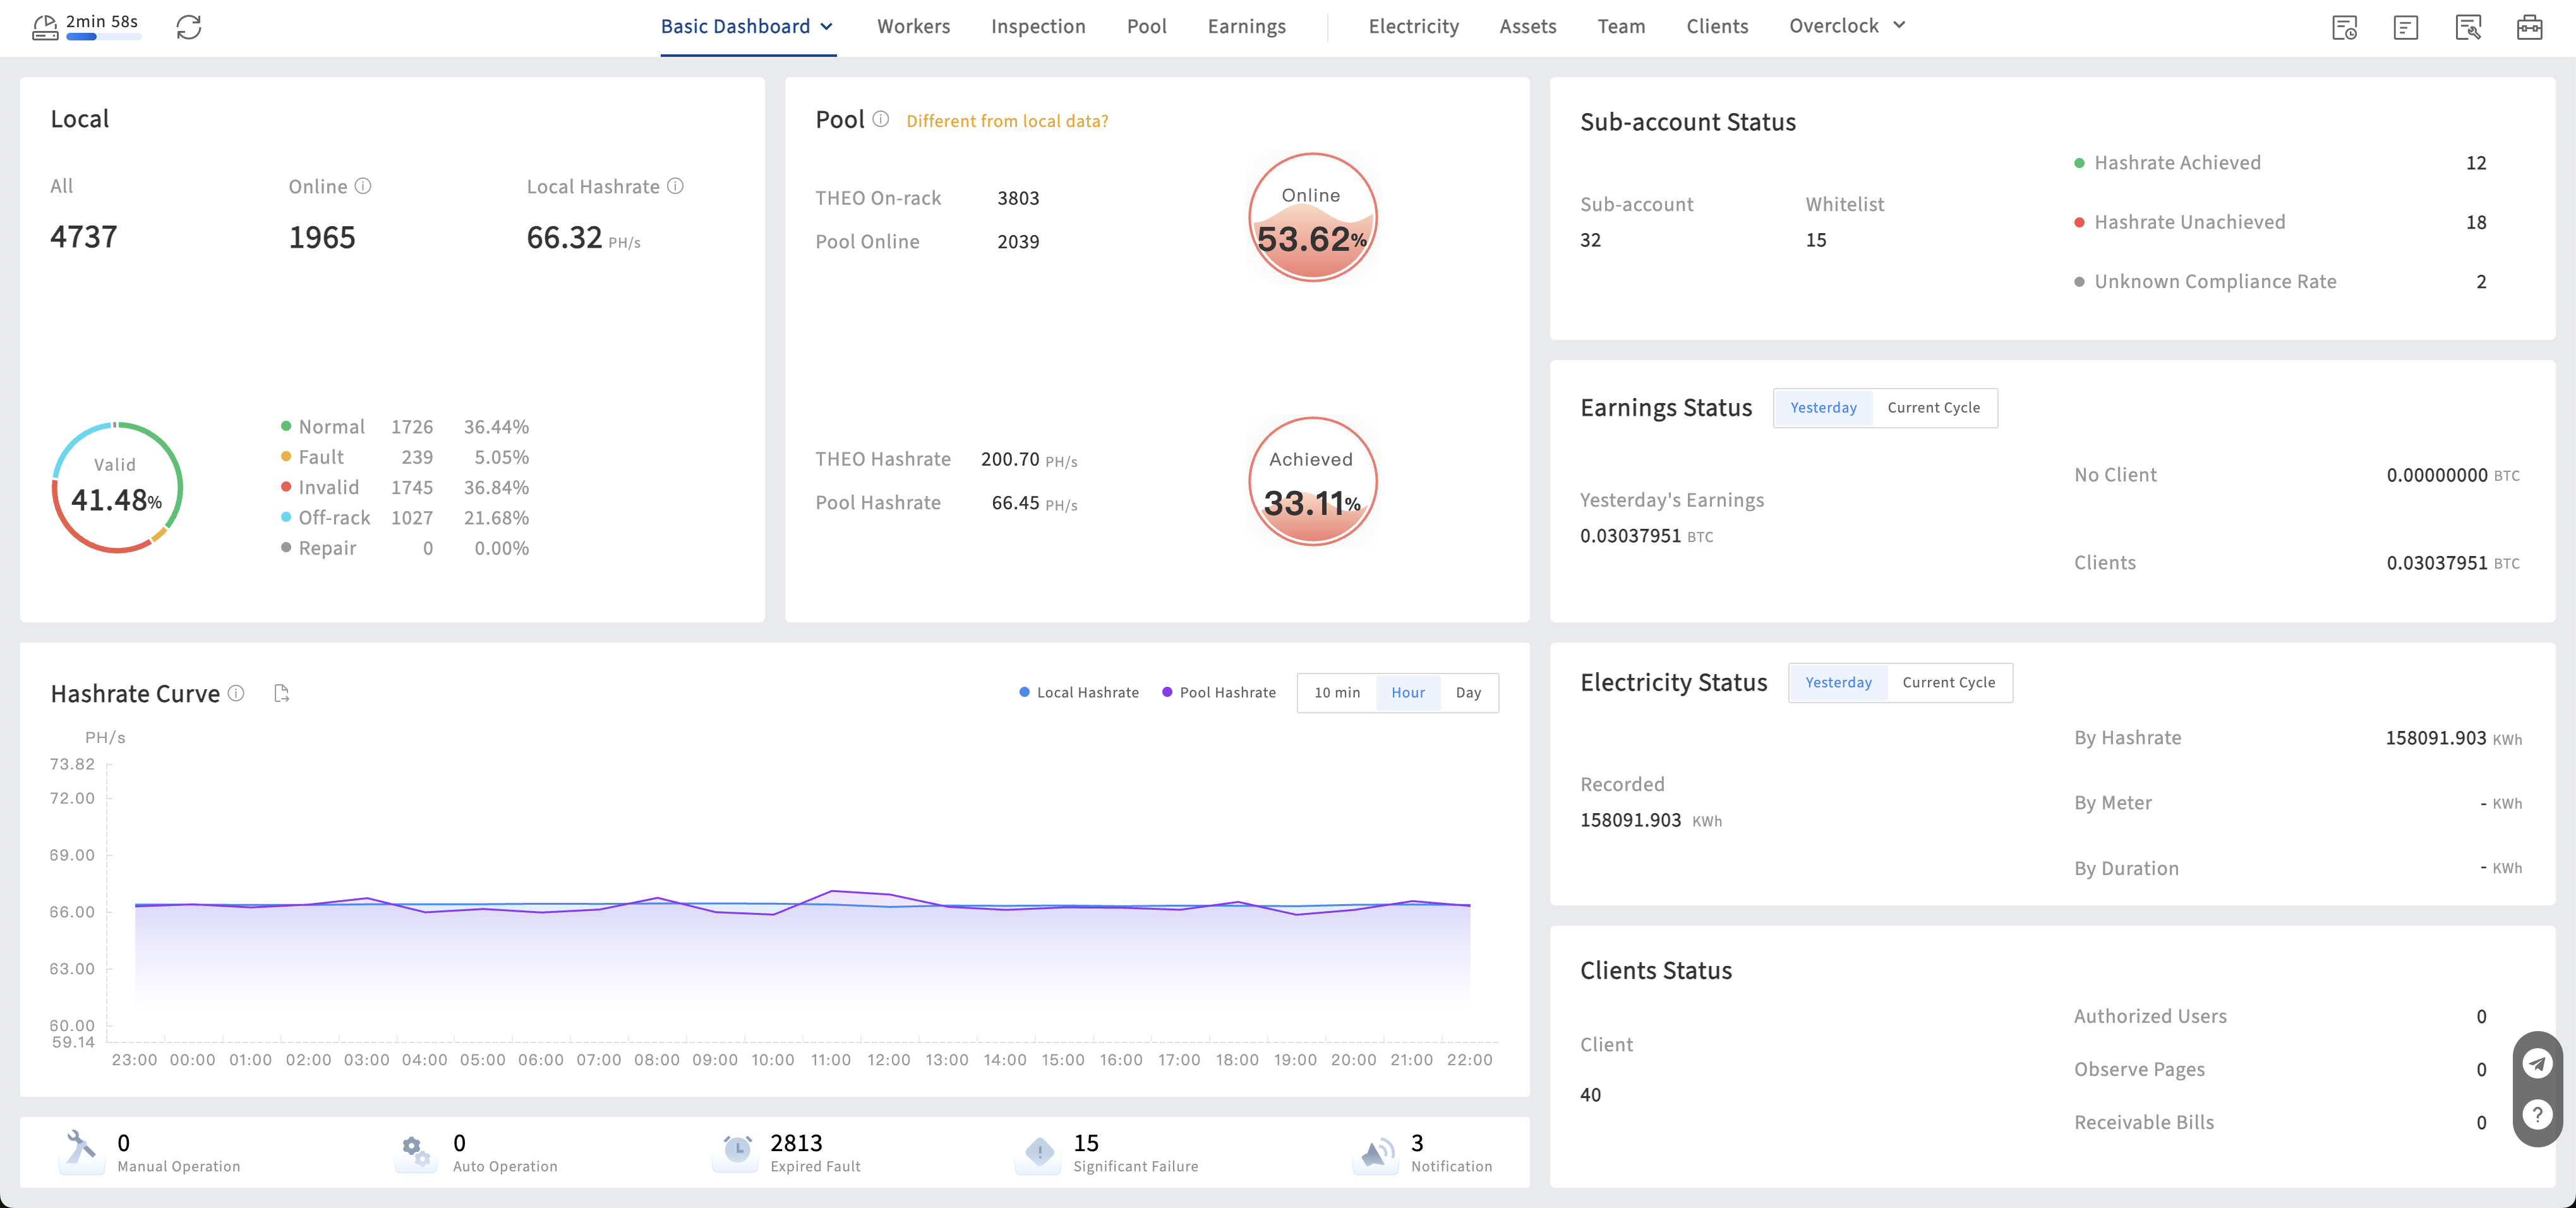
- Local Monitoring — This block displays the total number of miners detected on-site, their online status, and the total local hashrate. It includes an Efficiency gauge that shows the percentage of "Normal" miners versus those in "Fault," "Invalid," or "Under Repair" states.
- Usage: Managers use this to quickly assess if the physical equipment is performing at the expected capacity.
- Pool Monitoring — Unlike local data, this pulls information directly from the mining pools. It shows the "Online Rate" and Hashrate Compliance Rate.
- Usage: This is critical for detecting network issues or "stale" shares where miners are working locally but the pool is not receiving the data.
- Sub-account Overview — Displays the number of active sub-accounts, those meeting hashrate targets, and any Whitelist abnormalities.
- Usage: Ensures that all mining efforts are directed to the correct accounts and identifies potential security risks if unauthorized sub-accounts appear.
- Revenue Overview — Summarizes earnings from the previous day and the current period, categorized by client attribution.
- Usage: Used for financial auditing and verifying that the farm's output aligns with market conditions.
- Electricity Overview — Provides the actual power consumption based on three possible calculation methods: meter readings, hashrate-based estimation, or runtime-based estimation.
- Usage: Essential for calculating the Revenue/Gas ratio and ensuring that electricity bills are accurate.
- Client Overview — Lists the number of authorized clients, shared observer pages, and pending bills.
- Usage: Vital for hosting providers to manage their service-level agreements (SLAs) and billing cycles.
II. Operations&Maintenance Dashboard Features
The Operations & Maintenance Dashboard is built for speed and technical troubleshooting.
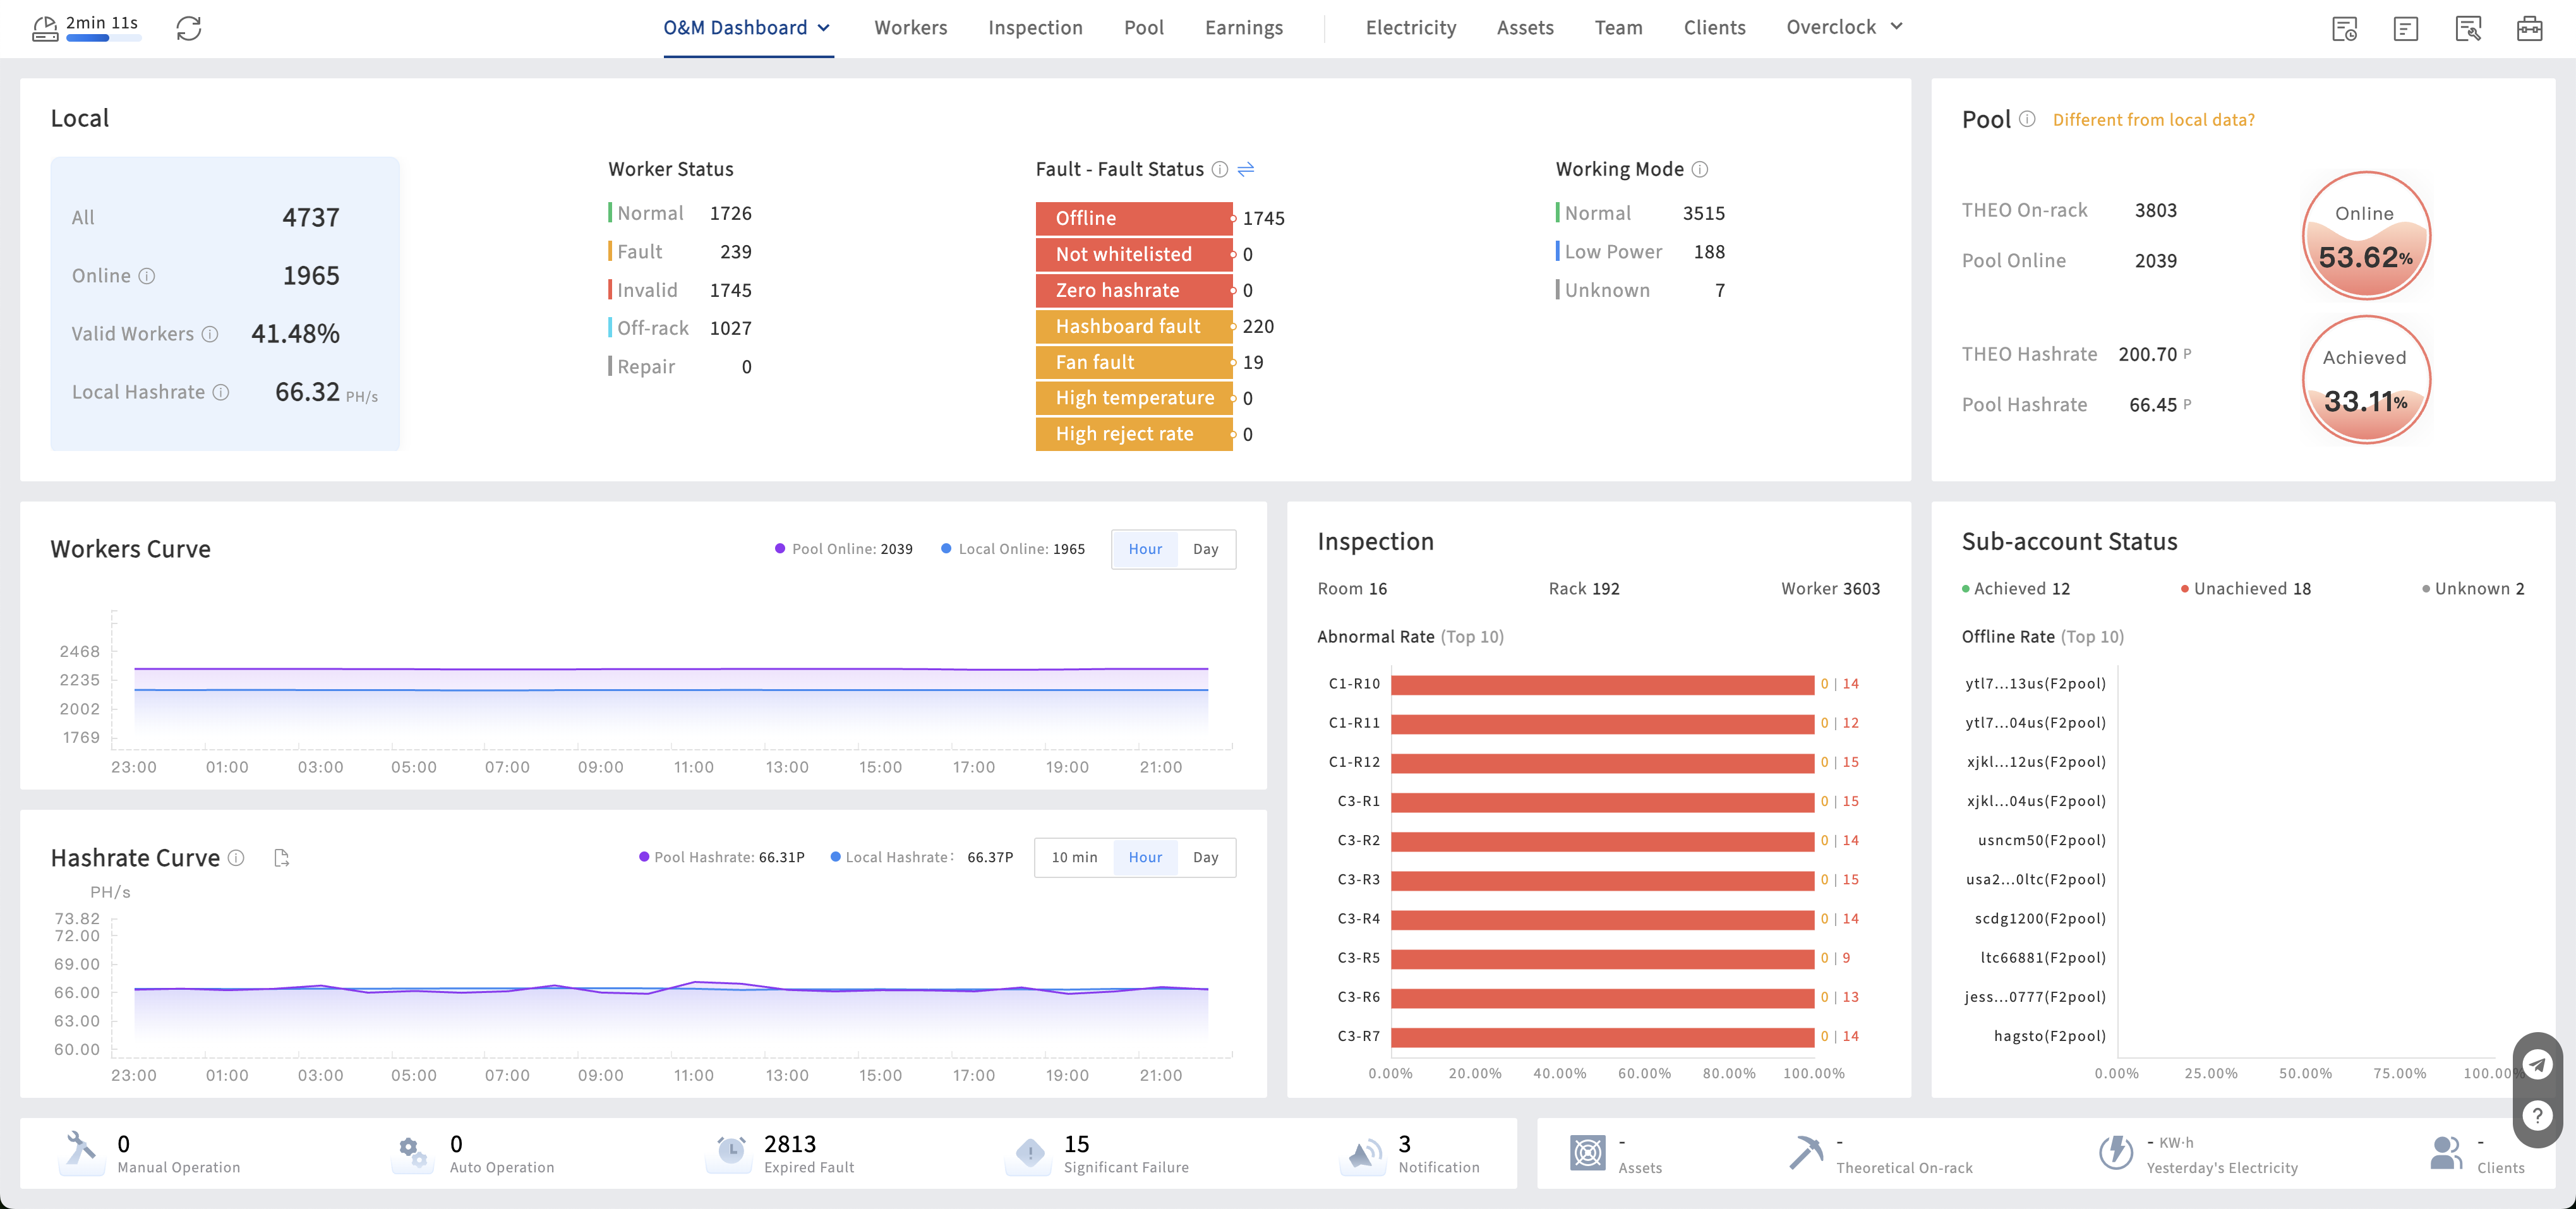
- Hashrate & Online Comparison Curves — This is a signature feature of ItsMiner. It overlays Local Data against Pool Data on a single 24-hour timeline.
- Usage: Technicians use this to spot discrepancies. For example, if the local hashrate is stable but the pool hashrate drops, it indicates a network or pool-side connectivity problem rather than a hardware failure.
- Fault Distribution (Top 10) — The dashboard automatically identifies the Top 10 Faulty Racks and Top 10 Faulty Sub-accounts.
- Usage: This allows teams to find patterned failures. If one specific rack has a high failure rate, the issue is likely environmental (e.g., poor ventilation, faulty PDU, or a localized network switch failure) rather than individual miner defects.
- Real-time Operation & System Notifications — A scrolling log of all manual and automated actions (e.g., "Restarting Miner") and critical system alerts.
- Usage: Enables supervisors to track the progress of the maintenance team and ensures that automated tasks (like high-temperature protection) are executing correctly.
- 24-Hour Critical Alerts — Highlights major issues that have remained unresolved for over 24 hours.
- Usage: Acts as a "catch-all" to prevent small faults from being overlooked during shift changes.
3. Best Practices for Using ItsMiner Dashboards
To maximize the value of these tools, ItsMiner recommends a standardized O&M workflow:
- Morning Routine: The supervisor checks the Operations & Maintenance Dashboard to identify the most critical rack-level failures and "Top 10" issues.
- Task Assignment: Faulty miners are grouped into Trouble Tickets directly from the dashboard and assigned to engineers via the mobile app.
- Visual Inspection: On-site engineers use the Inspection Map View—a "digital twin" of the farm—to find the exact physical location of faulty miners.
- Business Review: Farm owners review the Business Dashboard weekly to assess profitability, verify electricity efficiency, and generate client bills.
In conclusion, the dual-dashboard architecture of ItsMiner provides a comprehensive view of the mining operation. By separating business management from technical O&M, ItsMiner enables mining farms to operate with professional-grade transparency, safety, and efficiency. Whether you are a technician troubleshooting a heat-stressed rack or a manager auditing monthly revenue, ItsMiner delivers the precise data needed to make informed decisions.
Subscribe to ItsMiner's Blog
Get the latest posts delivered right to your inbox